 Abingdon
Loop Simulations
  Abingdon
Loop Simulations
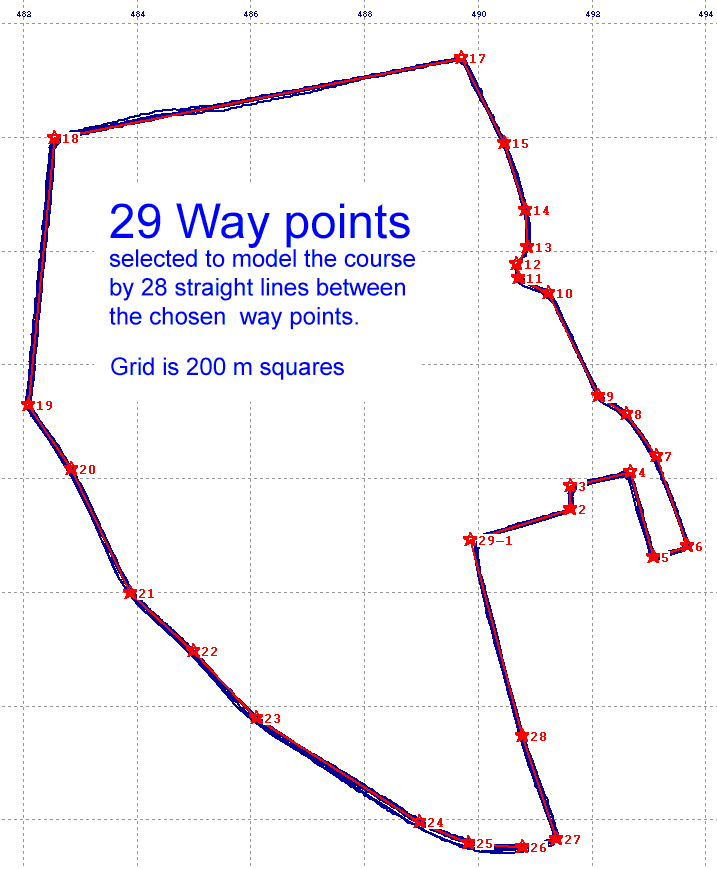
 The method used for simulating the GPS measurement of the Abingdon 4.5k loop is similar to the methods used to model polygon routes .

100 simulations of the above model give an average length 4573 m, with a standard deviation of 10 m.
The average length of 4573 m is about 40 m longer than the actual length of the course. This is because the way points did not follow the curves at the apex of a corner but were positioned outside the SPR in order to line up with the straights. A correction could obviously made for this. For example more points could be recorded at the corners, however this could add noise. Alternatively the shape and true distance at the corner could in principle be measured separately and a correction made. However the correction was made, the model provides a lower limit to the error which there will be in the measurement of this course with my GPS which exhibits and standard deviation of 2.33m in each coordinate of a measured way point.
In the next article of this series, the value of 10 m standard deviation obtain from this modelling of GPS measurements of this course will be compared with numbers obtained by riding the course and recording the GPS track or using the GPS's odometer function.
Mike Sandford - 2 April 2009