 Using GPS tagged Images in COURSE MEASUREMENT for Road Races
  Using GPS tagged Images in COURSE MEASUREMENT for Road Races
 Over the last few years GPS data has become widely available in photographs taken with smart phones and tablets, and also many digital cameras. I have been exploring software and procedures for using such geotagged photos in course measurement reports. I shall use as an example data taken with my latest setup which mounts a Samsung Tablet Computer on my Bike:

On the right you see the fixing for the tablet on my bike (a propotype version made from plywood)
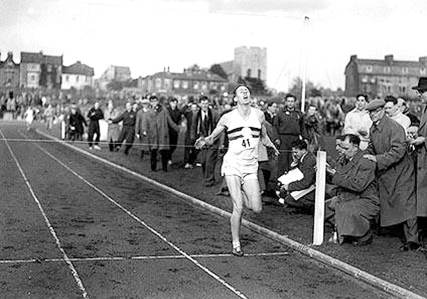
The location is on the Iffley Road track on which Sir Roger Bannister recorded the first 4 minute mile 60 years ago. I am measuring the Oxford Half Marathon and the race director captured me at the finish of what he has planned as the Bannister Mile - which is a timed mile within the half marathon race which passes near the 6 mile point around the Iffley Road track.
 If you compare the background buidings in the photo on the right with the historic photos from 1954 (on left), you will see the same buildings in the background across Iffley road. We are not sure of the exact location of the finish line in 1954, because the track has been upgraded - from a 440yard cinder track to a 400m rubber surfaced track. Although there are plenty of references around the university sports centre, to the historic event, we could not find any plaque marking the exact 1954 finish line, so the runners in the Oxford Half marathon will have to be content with this close approximation to the historic location. the runners will cross a timing mat around the 5.3 mile point as they proceed past the turn to Iffley Village, enter the University Sports Centre grounds via Jackdaw Lane, do about 280m on the track to cross a timing map at the end of the mile, before exiting the tack and continuing to the half marathon finish in the Oxford Kassam Stadium.
While measuring this half marathon I was using the tablet computer to record my Jones counter reading. I still used my note book as a back up to record the ride start and end counts, but for the splits locations during the ride, i relied solely on the tablet computer's camera, which nicely captures the counter reading together with the gps location.
Back at home I found it very easy indeed to flip through the clear images recorded on the tablet and transcribe the counter readings on to my calculation spreadsheet - no chance of wrongly recording a digit as sometimes happens with data copied from the counter to my notebook, especially in poor lighting conditions.
The tablet can be set to geotag the images, with the latitude and longitude from its built in gps. I have been experimenting to find convenient ways of getting at the GPS data and using it in my measurement reports. The following account gives examples of methods have I found available on the web. This is very much work in progress and i will be updating it as I gain more experience.
I would also very much welcome information and suggestions from others who may have experience of doing this sort of thing.
Mike Sandford 25 August 2014
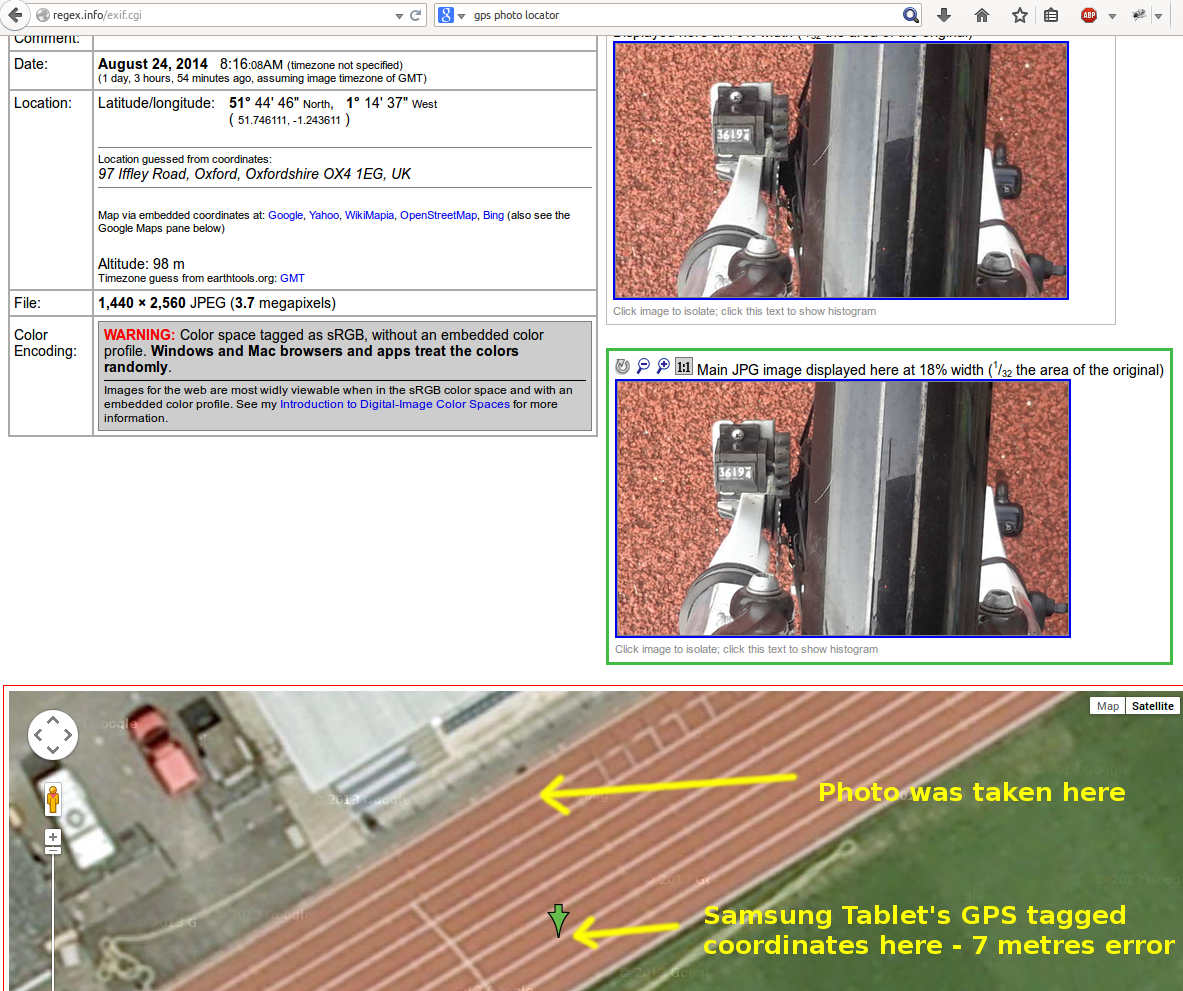
The gps data is recorded in an exif format in the image file from the camera. Many apps will read these data, but I discovered that some (eg imageviewer on my Ubuntu pc) do not show the location data. As a quick fix for this I tried web services, and I found the rather useful regex.info . you upload your image and get a nice screen back showing the location- see my screen shot:

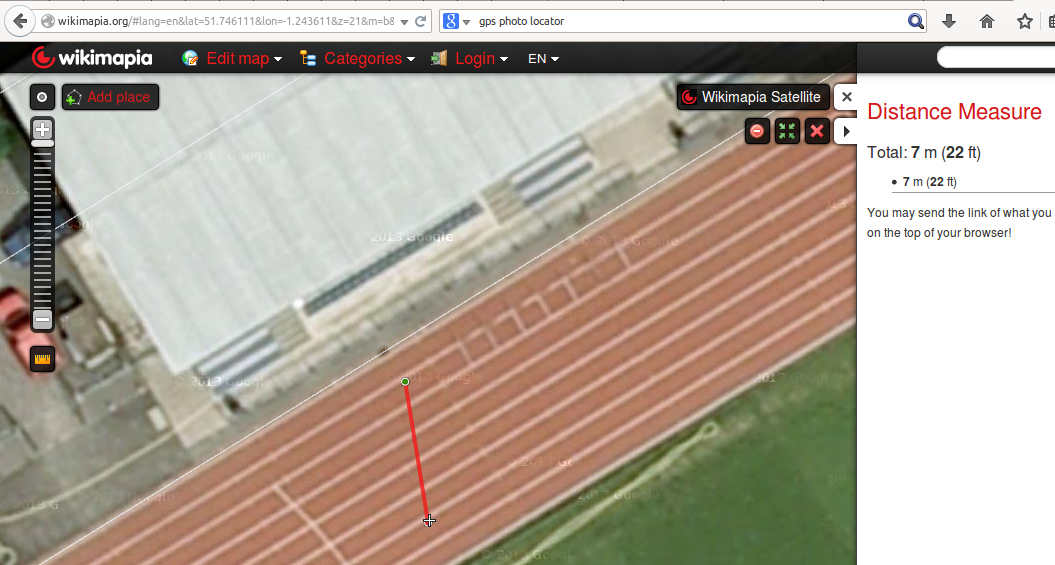
By default the picture location is shown on Google satellite view, which is exactly what I usually need. Other mapping services can be selected: See the links to Yahoo, Wikimapia, OpenStreetMap, and Bing. Wikimapia - uses google but has a nice distance measuring option which i used to measure the 7m difference between the GPS location and the actual Photo location - marked up in yellow on the image above. Here is the Wikimapia image:

In the above satellite view you can see the black drain gully at the edge of the track which we used for the finish line location.
Here is the photo of the location which I took with my (non-GPS) digital camera, I have edited in the counter reading from my tablet computer and drawn the required finish line: all nicely recorded for my file of photos for inclusion in my measurement report.

The next ideal step would be to automate all this and also locate the split points on a course map.
I am on the lookout for any software which will help in this process.
I would greatly welcome any ideas. If you wish to contribute a suggestion for this web page, please email me.
Contributors:
Author and webmaster: Mike Sandford.